Search
The Insider's Guide to the Housing Delivery Test
Will the Housing Delivery Test (HDT) help your planning application or appeal? How is it calculated and where can the underlying data be found? Here's your quick guide to :
- impact of the HDT, including HDT results for every LPA to date;
- minimum housing needs latest calculation using the standard method at 21st May 2026;
- a toolbox of ideas for making the case for housing development in planning applications and appeals.
To understand how the HDT works and how it is calculated, including the number of houses deemed to be needed using 'the standard method', read on.
Impact of the Housing Delivery Test on planning decisions
The draft NPPF 2025 states, "Where delivery falls below 75% of the requirement over the previous three years, an evidenced unmet need for housing is deemed to exist for the purpose of applying policy S5(1)(j) in this Framework." The outcome is broadly the same as the existing NPPF 2024. In fact the draft NPPF 2025 does not materially change the HDT. It's here to stay, it seems.
NPPF 2024 sets out in paragraph 79 the consequences of failing the housing delivery test. It states that where delivery falls below 75% of the requirement, the “policies for the supply of land are out-of-date”. This in turn triggers the “tilted balance” in applying the presumption in favour of sustainable development set out in NPPF paragraph 11(d).
Table 1: Number of LPAs failing the Housing Delivery Test over time
| HDT result | Consequences | 2019 | 2020 | 2021 | 2022 | 2023 | 2024 | 2025 |
| <75% | PRESUMPTION in favour of sustainable development | 8 | 55 | 51 | 61 | 63 | awaited | awaited |
| 75-85% | BUFFER 20% more land required for 5 yr land supply | 73 | 19 | 19 | 19 | 29 | ||
| <95% | ACTION PLAN To increase supply | 26 | 33 | 23 | 21 | 18 |
There are some important caveats which make the tilted balance less clear-cut than you might hope, explored in my blog back in January 2023 on whether it makes any difference to your planning appeal’s chances of success. Despite the caveats, any local planning authority which over the past three years has delivered less than 75% of its housing requirement is undoubtedly on the back foot and should be more likely to welcome housing developments.
Understanding the Housing Delivery Test and using it to support your planning case
“Optimism is evidence based” so using clear, objective facts in your planning statement or appeal statement of case can make all the difference to obtaining planning consent. If you know where to look, various official statistics provide valuable evidence you can use to support your planning case in a manner which will help a planning officer or planning inspector reach a positive decision. This is why understanding the housing delivery test and how you can use it to support a planning proposal can be so useful.
The HDT measurement rule book sets out the simple calculation as follows:
Housing Delivery Test (%) =
Total net homes delivered over 3 year period
divided by
Total number of homes required over 3 year period
The HDT results are published (in theory) in November or December each year but you can usually estimate them several months before publication using the methodology below.
Using 'Net Homes Delivered' to support your planning application or appeal
'Net homes delivered' is the national statistic for net additional dwellings over a rolling 3 year period, with adjustments for communal accommodation. It's quite straightforward to obtain the 'net homes delivered' figure. Simply download these 2 tables from the DLUHC website here (last updated 21st May 2026) and add the totals for your local planning authority together:
- Table 122 for net additional dwellings over the previous 3 years; plus
- Table 124 for net change in communal accommodation, converted into 'equivalent dwellings' for the previous 3 years. Communal accommodation is measured in bedspaces not dwellings, so there is a quick conversion to divide student bedspaces by 2.4 and other communal accommodation by 1.9 to give a proxy figure for the equivalent number of dwellings.
Using 'number of homes required' to support your planning application or appeal
The official 'housing requirement' of the LPA is the LOWER of:
• the adopted Local Plan housing requirement, providing this is less than 5 years old or has been reviewed and does not need updating; OR
• the minimum annual local housing need figure, calculated using the “standard method”.
The standard method is set out in detail in the National Planning Practice Guidance (NPPG) on “housing and economic needs assessment” and is:
- a baseline figure of 0.8% of the existing housing stock for the area using the latest available figure in MHCLG's table 125: dwelling stock estimates by LPA;
- adjusted by the most recent affordability ratio as published by ONS in its table 5c on median workplace-based affordability ratios.
For housing delivery test purposes, the HDT measurement rule book states in paragraph 15: "Where the minimum annual local housing need figure applies, this number should be calculated with a base date of 1 April each year. This calculation should use the affordability ratio for the previous calendar year. The affordability ratios are published by the Office for National Statistics. The resulting minimum annual local housing need figure will then be used for the Housing Delivery Test calculation." In other words, take the housing stock and the affordability ratio for each of the last 3 years to calculate the number of homes required in each of those years, for HDT purposes.
If the affordability ratio exceeds 5, an upward adjustment is made to housing needs. For each 1% the ratio is above 5, the housing stock baseline should be increased by 0.95%. an authority with an affordability ratio of 10 will have a 95% increase on its annual housing stock baseline. The formula used for this sliding scale of adjustment is: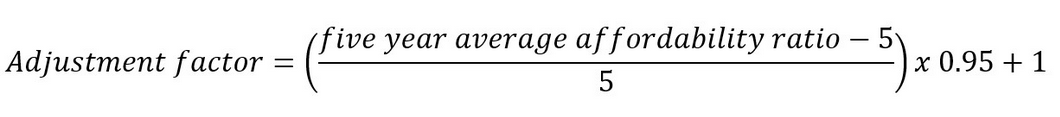
Don't let the formula put you off - it is easier to use than it looks. Some useful examples of the calculation are found in the National Planning Practice Guidance here.
A calculation of each LPA's minimum annual local housing need using the prescribed 'standard method' as at May 2026 is available here, but it is always worth checking the original datasets linked above in case the Government have issued updated figures on dwelling stock (MHCLG's table 125) or updated the affordability ratio.
Planning Inspectors and other decision makers can be swayed by hard evidence. An effective strategy is to compare housing delivery against housing requirements, to demonstrate the scale of the shortfall in housing. This gives you key evidence the local planning authority needs housing, and helps refute any case from objectors that new housing development is “not needed”.
Appeal Decisions Online
Planning Appeal Search
- All English planning appeals 2010-2026
- Inspectors' original descriptions of proposed development
- Quick view A.I. summary of the appeal's Main Issues
- Powerful search with map and advanced searching tools
Easy Cost Effective Access
- Helps you make a stronger case to win planning consent
- Free trial, then a simple Monthly or Annual subscription
- Helpful Blogs and LPA quick links
- An indispensible resource for all planning professionals
Loved by Customers
Berrys
Loved by the Industry

 Loved by You? Try us and see; FREE for a month.
Test our service entirely free for a month. There's absolutely no obligation and there's no payment details required. We're sure you'll be pleasantly surprised, so just complete our Free Trial request form today.
Howie Associates Ltd trading as AppealFinder® Terms & Conditions Cookies Policy Privacy Notice Follow on LinkedIn ![]()
Contains public sector information licensed under the Open Government Licence v3.0
